Archive for the ‘Social’ Category
TWITTER: IPO is on the Horizon – Part 2
Twitter, Inc. (TWTR) is set to have its first day of trading on Nov. 7th, 2013. With all the wait, buzz, anticipation and even speculation on one of the hottest IPO’s of the year, how would investors prepare themselves for this sizzling stock?
Several market participants, analysts, investors, or even entrepreneurs have offered their views on how to proceed in terms of investing in Twitter, Inc.
The well-known host of CNBC’s Mad Money, Jim Cramer, said that individual investors should be aware of the order-pushing technique from the stockbrokers and sales persons, since they are pressured by institutional investors to unload shares for them and hefty margins may be built into shares that are about to change hands into retail investors, according to this Yahoo article.
Mr. Cramer suggested that retail investors should think twice before paying for Twitter’s stock for more than $28 per share, which would give Twitter a market value of $15 billion.
Another market participant, Vivek Wadhwa, also a tech entrepreneur, academic, and writer thinks that the valuation of Twitter has been over-inflated due to the build-up from the insiders rounds of financing and the subsequent demand of return on investments, according to this Yahoo article. He also mentioned that Twitter’s business model might not be sustainable, given that it is operating in a crowded space with its chinese counterpart Wechat and japanese counterpart Line.
We have seen Twitter’s financial statement from its Form S-1, from our previous post: TWITTER: IPO is on the Horizon – Part 1, which shows that it has not turned profit. This is not a news to a lot of people. However, we noticed in the updated Form S-1, Twitter has shown an increasing trend of stock-based compensation in the nine months ended September 30th, 2013, as compared to a year ago. This factor would probably continue to weight down Twitter’s earning performance in the immediate quarters, which would pressure its stock price.

According to Twitter’s Updated Form S-1, its cash flow statement shows that depreciation and amortization are on the rise as well. For the nine months ended September 30th, 2013 alone, Twitter, Inc. has $77.67 million in depreciation and amortization expenses, which surpassed the yearly amount of depreciation and amortization expenses, i.e. $72.50 million, in year 2012. This is partly due to the acquisition spree that Twitter, Inc. was on. This factor may weight down the earning performance in the upcoming quarters as well.

Moreover, Twitter has estimated that $24 per share, the midpoint range of the estimated offering price range set forth on the cover page of its prospectus, will bring in approximately $1.62 billion from the sale of shares in the offering. However, with more cash sitting in Twitter’s bank account, investors may start to pay more attention on how it uses this amount of cash, given that many activist investors recently publicly expressed their views on better usage of corporate cash, i.e. hedge fund manager David Einhorn’s bid to block Apple Proxy Vote, as reported by WSJ.
Lastly, Twitter has disclosed its valuation on various dates in 2013. The lower range of its per share value is at around $17 dollars. Combined with its $24 per share initial offering price point, there is a built-in 41.17% increase in this initial price point. So buyers beware!
YELP: To Grow Revenue or To Grow Cash?
YELP, Inc. (YELP) released its financial results for the quarter ended September 30th, 2013 on Oct. 29th, 2013. The online local business reviews site, for the most recent quarter ended September 30th, 2013, has revenue of $61.18 million, a 68.21% increase as compared to the same period a year ago. In terms of the bottom line, Yelp still operated in the red-ink territory with $2.3 million in net loss for the most recent quarter. On Oct. 29th, 2013, Yelp announced that it will issue a follow-on offering to sell around $250 million of Yelp’s Class A common stock, par value $0.000001 per share, according to its prospectus filed. Several companies have issued follow-on offerings so far this year, due to recent strong stock rally, including Linkedin and Telsa.
So let’s take a look at Yelp’s financial statements briefly before discussing further on the follow-on offering.
First of all, Yelp’s income statement shows a steady cost structure. With the largest expense item tied with sales and marketing, i.e. more than 55% of total revenue, it would be interesting to see how much revenue can be generated per unit of sales and marketing effort. For the quarter ended September 30th, 2013, YELP had generated $1.79 revenue dollar per unit of sales and marketing effort, only 5% increase from $1.70 revenue dollar per unit of sales and marketing effort in the same period a year ago. Historically speaking, YELP had generated $1.49 revenue dollar per unit of sales and marking efforts in the quarter ended September 30th, 2011, which jumped 14.05% to $1.70 same period in a year later. In retrospect, YELP had had growth rate of revenue in the range between 63% and 69% of total revenue since 2011, nevertheless, the growth rate of its cost structure had fluctuated between 49% and 64% of total revenue on the quarterly basis. For the quarter ended September 30th, 2013, we see the growth rate of total cost closely followed that of revenue, i.e. 64.29% of total revenue, which in turn would squeeze the room of profitability. However, for the nine months ended September 30th, 2013, we see that growth rate of total cost was not trailing as closely behind that of revenue as what we see on the quarterly basis.
On the balance sheet side, Yelp’s cash position stayed at roughly 45% to 50% of total assets. The second largest item on its balance sheet is goodwill, with more than 25% of total assets. On the liability side, Yelp only has less than 13% of total assets in liability.
If we take a closer look at the cash flow statement, we can see that depreciation and amortization has grown 65.15% from $4.8 million to $7.9 million for the nine months ended September 30th, 2013. Also, stock-base compensation has grown 53.93% from $11.6 million to $17.8 million. These two expense items might have affected the profitability in the quarter. In terms of cash management, YELP hold most of its cash at hand without any short-term investments. This would raise a question – with the follow-on offering amount $250 million, what would YELP do with all these funds?
Based on YELP’s closing stock price $67.05 and market value at $4.37 billion on Oct. 30th, 2013, the proposed follow-on offering $250 million would consist of 5.7% of total market value as of Oct. 30th, 2013. Compared to a recent follow-on offering closed in September by Linkedin, the online professional network raised $1.379 billion based on its-then-market-value of $26 billion, which would give out the percentage of the follow-on offering as 5.3% of total market value. Therefore, in terms of the percentage of the following-on offering in total market value, YELP needs to find a good use of these cash and generates returns on its cash position. Perhaps, management of YELP has already been pondering various treasury/corporate debts investments once they obtain new funding of $250 million.
However, according to YELP’s prospectus supplement filed on Oct. 31st, 2013, YELP planned to 3.75 million shares of Class A common stock, excluding 0.5625 million shares of Class A common stock that may be purchased by the underwriters pursuant to their option to purchase additional shares of Class A Common Stock. The total outstanding of Class A common stock after this offering will be 57,323,297 shares (57,885,797 shares if the underwriters’ option to purchase additional shares is exercised in full). New 3.75 million shares of Class A common stock only consist of 6.5% of total Class A common stock after this offering, without considering the underwriters’ option to purchase additional Class A common stock. YELP has Class B common stock outstanding after this offering 12.4 million shares, which are entitled to 10 votes per share, on all matters that are subject to a stockholder vote, as compared to a single vote entitled to holders of Class A common stock.
Lastly, on the macroeconomic level, Fed has remained its pace of bond purchases until the outlook for labor market improved substantially, according to this Bloomberg article and FOMC’s own press release. This probably would not trigger any disturbance or sell-off in the market yet due to a delayed consequence of tightening Fed’s bond purchasing program and monetary policy. However, most participants in the market agree that the tapering action will come unavoidably and eventually, the more important question is when the tapering action will come. This factor should be considered when investing in these follow-on offerings.


Bottom Line: YELP debuted its IPO on March 2nd, 2012 with the price of $24.58. Since then, YELP had a good run of 172% increase in its stock price. Investors should pay attention on the sustainability of this momentum and growth rates.
TWITTER: IPO is on the Horizon – Part 1
Twitter, Inc., one of the pioneer social networking sites, had filed its long-anticipated Form S-1 on October, 3rd, 2013. Many market participants, analysts and observers had immediately noticed that the 140-character texting platform still not yet turned profit for the second quarter. However, there are still so many details to be absorbed before one even considers investing in one of the hottest IPO’s for the year.
Let’s dig in Twitter’s financials statements briefly before going further.

First, for the six months ended June 30, 2013, Twitter has revenue of $253.63 million, a 107.29% increase compared to a year ago. On the annual basis, Twitter, Inc. has 276% and 198% increase, in 2011 and 2012, respectively. On the profitability front, Twitter, Inc has net loss at $69.25 million for the six months ended June 30, 2013, a 41.03% increase as compared to a year ago. Net loss, on the annual basis, however, was decreasing at 38.12% in 2012 while growing at 90.57% in 2011. So in terms of short-term profitability, it is still foreseeable that net loss will continue to fluctuate up and down, not consistently improved. One of the major expense items is stock-based compensation, embedded in research and development and GA&E accounts. As Twitter, Inc. has disclosed in its Form S-1, as of June 30, 2013, it has increased its headcount to approximately 2,000 employees, which is nine-fold larger than what it had in 2009.
Since 2011, Twitter had ramped up its efforts in recruiting, retaining and attracting talents in order to grow its business to a next stage. As seen in the growing number of its headcount and it weights on the cost structure, we can also see that stock-based compensation would be carried on its cost for the upcoming years. According to Twitter, Inc.’s Form S-1, if the IPO offering had been completed on June 30, 2013, it would have to record $329.60 million of cumulative stock-based compensation expense related to the Pre-2013 RSUs and an additional $234.20 million of unrecognized stock-based compensation expense related to the Pre-2013 RSUs, net of estimated forfeitures, would have been recognized over a weighted-average period of approximately three years. Also, unrecognized stock-based compensation expense of approximately $296.7 million related to other outstanding equity awards would have been recognized over a weighted-average period of approximately four years. After June 30, 2013, Twitter, Inc. had continued to make grants of equity awards of $452.9 million, after giving effect to estimated forfeitures, which is expected to be recognized over a weighted-average period of approximately four years.
On the merger and acquisition side, Twitter has been aggressively picking up startups that will compliment, augment, and expand its business to a larger scale. Since 2011, Twitter, Inc. has gradually used its stock to purchase companies instead of cash. For example, according to Twitter, Inc.’s cash flow statement, it spent $18.9 million and $1.5 million in cash, net of cash acquired, in 2011 and 2012 to purchase companies. However, the total purchase prices paid by Twitter, Inc. to acquire companies in 2011 and 2012 were roughly $38 million and $53 million, respectively. In 2013, Twitter, Inc. had spent around $105 million in total purchase prices to acquire two companies, more than 90% of which was in Twitter, Inc.’s stock.
On October 15, 2013, Twitter has also disclosed its third quarter of financial performance, according to this Bloomberg article. Twitter, Inc.’s revenue in the third quarter was $168.6 million even while net loss stayed at $64.6 million for the quarter.


Bottom Line: Twitter, Inc. has prepared to list its stock soon. However, investors should pay more attention on its profitability for upcoming quarters and potential selling pressure from existing shareholders.
ZULILY: E-commerce 2.0 for Moms and Babies, Part I
The flash sale industry was born out of the aftermath of 2008-2009 financial crisis. The so-called limited-time heavy-discounted business model had been capturing attention of many. Gilt Groupe, Rue La La, One Kings Lane, etc are all in this industry selling different products to various customers. Zulily, is also one of the disrupt e-commerce platforms that specialize in selling goods to mothers and their babies.
It was founded in 2009, and has been growing rapidly. On Oct. 8, 2013, it has filed with SEC its Form S-1 in preparation to file IPO soon. From there, we can take a look at its financial statement briefly and see how it has been performing in operation.
First of all, we can see that Zulily just recently turned profit, landing at 0.88% of the total net revenue for the most recent quarter. In flash sales industry, the percentage used to split profit margin with vendors directly determines the trickle-down effect on net profit of a flash sale company. As we can see that the gross profit margin hangers around 28% to 30% for the past several quarters, it implies that for the immediate upcoming quarters, Zulily probably would have the same percentage of net revenue in gross profit. Therefore, when gross profit is somehow predictable, then the next important indicator is the growth of net revenue for participants in this industry. Historically speaking, the growth rate of net revenue for Zulily was 114.20% for six months ended June 30, 2013 compared to same period a year ago, while on the annual basis, the growth rate of net revenue for Zulily was 132.38% and 675.71% for 2012 and 2011, respectively. Zulily had an impressive year in 2011 with growth rate exceeding sixfold as compared to 2010 and it remains to be seen that the growth momentum can be continued into 2013 and later. On the cost side, the growth rate of cost of goods sold (COGS) was 109.86% for the six months ended June 30, 2013, as compared to same period a year ago. If put on the annual basis, the growth rate of COGS was 129.59% and 734.65% for 2012 and 2011. Meanwhile, total operating expenses followed this similar pattern, with 125.27%, 105.2% and 309.13%, for six months ended June 30, 2013, twelve months ended December 30, 2012 and twelve months ended January 1, 2012, respectively.

On the balance sheet, we can see that Zulily has very focused on its current assets, which consistently occupied more than 86% of total assets for the last 2 years. Zulily has not poured money into M&A yet, as no goodwill or intangible assets account exists on its balance sheet. In terms of debt, regardless of short-term and long-term, Zulily has managed that the debt, in the percentage of total assets, has dwindled from nearly 50% to 43%. This is another indicator to watch out for when Zulily officially files its first Form 10-Q/10-K, the debt-to-equity should be low combined with the incoming funding raised in the public market. This would broaden the financing options for Zulily in next few years, as their debt level is relatively small and better-capitalized, provided that IPO is a success.


In terms of cash management, net cash generated by operation activities has been positive for the year 2011 and 2012. This is largely due to the temporarily pile-up in accounts payable to its vendors and increasing depreciation expenses in 2012. At the same time, Zulily has been raising funds from venture capitals in both 2011 and 2012. As of June 30, 2013, most of funds raised from venture capitals has been sitting in Zulily’s corporate cash account and short-term investment account.

Bottom Line: Zulily has been growing rapidly, due to well-accepting responses from early adopters, especially young mothers, and excellent execution on its operations. However, given the outlook of general economy and quarterly reporting constraints as a public company, Zulily’s growth might be put to test to see whether its profitability can rise higher.
SALE: RETAILMENOT’s Costly Growth
Retailmenot, Inc. (SALE) has debuted on NasdaqGS market on July 19, 2013, with the opening price set at $21 per share and it closed at $27.70, a 32% increase on the first day trading. According to its prospectus, Retailmenot was offering 4,545,454 shares of its Series 1 common stock, and the selling stockholders identified in its prospectus planed to offer an additional 4,545,454 shares of Series 1 common stock, who ended up selling an aggregate of 5,909,090 of such shares, including 1,363,636 shares, i.e. 23% more than planned in the prospectus, as a result of the underwriters’ exercise of their over-allotment option to purchase additional shares, according to its latest Form 10-Q. As the result of its IPO, Retailmenot has received net proceeds of $86.10 million, after deducting underwriting discounts and commissions. With the proceeds of the IPO, Retailmenot will pay down accumulated dividends on previously redeemable convertible preferred stock, totaling $52.5 million and the outstanding principal and accrued interest on seller notes issued in connection with its acquisition of eConversions Limited in 2011, which totaled approximately $6.6 million, according to its Form 10-Q. Therefore, Retailmenot has only received around $26 million in cash immediately after IPO, based on the disclosures in its Form 10-Q.
Let’s take a look at Retailmenot, Inc’s financial statement briefly to see how they have been doing. Retailmenot, Inc. has reported a strong quarter as a public company the first time on August 23rd, 2013. For the three months ended June 30, 2013, its net revenues has grown 44.25% on the year-to-year basis, from $30 million as of June 30, 2012 to $43 million as of June 30, 2013. For the six months ended June 30, 2013, its net revenue had also grown 40.56% on the year-to-year basis, from $60 million as of June 30, 2012 to $84 million as of June 30, 2013. The cost structure had also grown substantially, from $20 million, for three months ended June 30, 2012, to $34 million, same period a year after. Net income has been hovering between 11.80%, for three months ended June 30, 2013, and 14.41%, for six months ended June 30, 2013. This shows that Retailmenot still enjoys its niche as world’s largest digital coupon marketplace, according to its Form 10-Q. However, its P&L statement also reveals that growth of revenue has to provide more wiggle room for growth of cost, which might be required as part of efforts for Retailmenot to grow further.
Also, Retailmenot has also announced in its Form 10-Q that all the outstanding shares of Series B-1, Series B-2, Series B-3, Series B-4 and Series B-5 preferred stock have been automatically converted into an aggregate of 38,072,967 shares of Series 1 common stock and all of the outstanding shares of Series BB-3 preferred stock have been automatically converted into an aggregate of 6,107,494 shares of Series 2 common stock in its IPO, there will be no more burden on accumulative dividends on preferred stock weighting on its P&L.
Interest expenses have been dwindling partly due to a new term loan agreement that Retailmenot secured with an entity affiliated with one of its stockholders in order to pay down fully the legacy borrowings, i.e. $25 million outstanding related to the acquisition of Retailmenot.com in November 2010.
In terms of cash management, Retailmenot has gradually recognized stock-based compensation expenses, which is expected to grow as the digital coupon company seek to expand its operations in next few quarters. However, for the six months ended June 30, 2013, not too much of cash outlay was used in investments and acquisitions. This implies that Retailmenot currently relies on cash generation by its internal operation, even though, on top of cash generated internally, it does have a $115.0 million revolving credit facility and a $35.0 million term loan facility from an entity related to one of its stockholders. We expect to see more cash management activities in the upcoming quarters.


Bottom Line: Retailmenot, Inc. has its own niche in the market and continues to grow after its IPO. However, one should pay more attention on whether the market has priced in its stock price the full earning potential for the immediate quarters.
GRPN: The Best is Yet to Come?
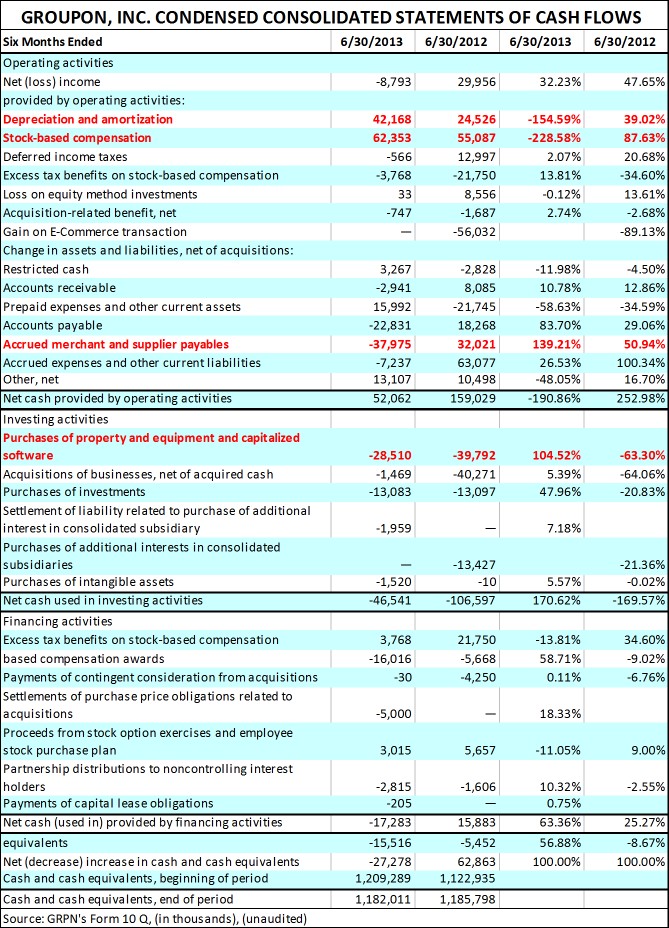
Groupon, Inc. (GRPN) released its second quarter financial results on August 8th 2, 2013, according to its latest Form 10 Q filed. Revenue for the three months ended June 30, 2013 came in at $609 million, a 7% increase as compared to a year ago. GRPN didn’t turn profit for the three months ended June 30, 2013 as it posted a net loss of $5.56 million, a 117% decline as compared to a year ago. On the quarter-to-quarter basis, GRPN has 1.22% increase in its gross revenue for the three months ended June 30, 2013, as compared to a quarter ago, and 71.22% widened in its net loss.
According to this Bloomberg article, Groupon’s chief financial officer Jason Child mentioned that GRPN’s north America region has continued to see strong growth, as GRPN is shifting its focus to the rest of the world to capture opportunities. In order to have a better understanding of what is going on behind the curtain, GRPN has for the first time provided its revenue breakdown across different regions and operating segments, it would be interesting to gauge how GRPN’s plan to pursue international opportunities pan out in near future from these standpoints.
Let’s take a brief look at GRPN’s financial statements before discussing opportunities and challenges faced GRPN.
First of all, we can see that Direct revenue has contributed 190% increase for the three months ended June 30, 2013, as compared to a year ago, in contrast, Third Party and other revenue slipped 16.7% for the three months ended June 30, 2013, as compared to a year ago. Even though total revenue is still on par with those on the YoY and QoQ basis, the quality of the revenue should warrant more attention from investors.

With this said, we break down the gross profit margin by GRPN’s operating segments and categories and we see that the gross profit margin from Direct revenue is between 8.23% and 12.60% for the three months ended June 30, 2013 in North America, while in both EMEA and rest of World, cost of revenue for the categories where GRPN acts as a merchant of record, rather a third party marketing agent, were larger than gross revenue by 52% and 8%, respectively. So as we mentioned in our previous post: GRPN: MIXED SIGNALS AHEAD, GRPN still relies much on its core business, which is from Third Party Revenue. Hence, if the measures on gross revenue and gross profit margin were considered altogether, GRPN has in effect presented a mixed signal to its shareholders and investors for the second quarter 2013, since the absolute dollar amount of Third Party revenue is slipping, i.e. from $503 million a year ago to $419 million, as of June 30, 2013, while the daily deal company keeps better gross profit margin from Third party revenue in North America, i.e. from 80.61% a year ago to 89% , as of June 30, 2013. As for EMEA and rest of world, there is a visible volatility in the corresponding gross margins in Direct revenue, the uncertainties in both EMEA and rest of world need to be addressed soon by GRPN in upcoming quarters.

On its balance sheet, GRPN didn’t show any major activities for the three months ended June 30, 2013. In terms of cash management, GRPN still has $1.2 billion sitting in cash and cash equivalent account, as of June 30, 2013, same as December 31, 2012. The current liabilities are also at $1.1 billion as of June 30, 2013, slightly better than $1.17 billion, as of December 31,2 012.
Given that GRPN’s stock prce has rallied more than 110% increase on year-to-date basis, i.e. from $4.86 on December, 31, 2012 to $10.21 on August 14, 2013, we expect to see that GRPN engages various ways to obtain financing other rather cash internally generated, i.e. both equity and debt financing, in order to beef up GRPN’s liquidity position and prepare for possible expansion of business, i.e. mergers and acquisitions. According to GRPN’s latest Form 10Q, its Board of Directors has announced in August 013, a share repurchase program, which authorize GRPN to repurchase up to $300 million of our outstanding Class A common stock over the next 24 months.
Morerover, given that the looming changes are coming in Fed’s monetary policy, some institutional investors have unloaded their GPRN holdings, according to the latest Schedule 13F filings due August 15, 2013.
Case in point: Tiger Global Management, L.L.C. in November 2012 purchased 9.9% stake in GRPN, i.e. 65 million shares, according to this WSJ article. It has unloaded more than 72% of its GRPN holdings in the second quarter of 2013, i.e. 47 millions shares, according to its latest Schedule 13F filed on August 14, 2013, .
Nevertheless, some institutional investor has ramped up their holdings in GRPN.
Case in point: Jana Partners LLC has increased its GRPN holding from 22 million shares to 35 million shares, according to its latest Schedule 13F filing.

Bottom Line: GRPN has doubled its stock price in second quarter 2013 as compared to December 31, 2012. However, as more uncertainties gather in overall condition of economy and stock market, the daily deal company needs to show its investors more than just growth in revenue in the second half of 2013.
PCLN: A New Record High
Priceline.com Incorporated, (PCLN) released its second quarter financial results on August 8th, 2013. The better-than-expected result propelled its stock price to reach a new record high, $994.98, on August 9th, 2013, which effectively replaces the old record $974 on a split-adjusted basis in 1999, according to this Bloomberg article and historical price on Yahoo Finance. According to PCLN’s Form 10-Q filed on August 8th, 2013, PCLN’s revenue for three months ended June 30, 2013 has jumped 26.64%, from $1.326 billion a year ago to $1.68 billion, as of June 30, 2013. This pattern of growth is reflected on the growth of gross bookings on both PCLN’s domestic and international operations, as shown in the following table. We can see that PCLN’s international operation, namely Booking.com, has fueled majority of its growth in the second quarter of 2013. The year-to-date picture reveals a similar growth for Booking.com. However, if we break down the revenue based on the originating region or segment, a different picture is depicted. PCLN’s Booking.com has contributed 13 cents into revenue per booking for the three months ended June 30, 2013, which is almost identical to the level seen for the same period a year ago. Agency revenue for the three months ended June 30, 2013 has included substantially all revenue from Booking.com. In other words, the growth of agency revenue is largely based on the growth in volume of bookings, not on pricing level of each transaction.
Meanwhile, merchant revenue mostly comprises revenue from PCLN’s domestic operations, Agoda.com, rentalcars.com, and ancillary fees. We can see that merchant revenue per booking has declined 19.22%, from 42 cents per booking a year ago, to 34 cents per booking, for three months ended June 30, 2013. Therefore, it is obvious, from this perspective, to see that the second quarter financial result came in as a positive surprise for PCLN’s shareholders and investors.

However, is the growth rate of revenue sustainable going forward, especially when PCLN’s has just reset its record stock price from the internet bubble-era? A new record high of PCLN’s stock price says more than just how much growth it has demonstrated.
Let’s take a look at its financial statements briefly before discussing the meaning behind PCLN’s new record high. PCLN’s cash, cash equivalent and short-term investment position had improved from $5.1 billion, as of December 31, 2012, to $5.8 billion, as of June 30, 2013. The increase of PCLN’s cash, cash equivalent, and short-term position was fueled partly by two private placements of $1 billion in March 2012 and May 2013, respectively. In the midst of growing liquidity, PCLN purchased Kayak software Corporation in a stock and cash transaction at a price tag of $2.068 billion on May 21, 2013, according to PCLN’s Form 8 K filed on May 21, 2013. 75% of the $2.068 billion was paid by PCLN’s stock and only 25% of the $2.068 billion was paid by its cash on hand, which shows that PCLN has put emphasis on growing its overall cash position and demonstrated its confidence in positive market reaction post-acquisition. This strategy has paid off so far and PCLN’s book value has grown to $9.9 billion, as of June 30, 2013, from $6.6 billion, as of December 31, 2012, a 50.19% increase in book value.
PCLN has net operating loss carryforwards (NOLs) of $1.2 billion after considering the impact of IRC section 382, according to PCLN’s latest Form 10-Q. PCLN also mentioned that the NOLs mainly expire from December 31, 2019 to December 31, 2021. The utilization of these NOLs is dependent upon the Company’s ability to generate sufficient future taxable income in the United States. As for PCLN’s foreign income, it has enjoyed favorable lower foreign tax rates than the U.S. statutory tax rate 35%, which would contribute to the growth of bottom line.


Even though PCLN’s financial position and profitability have remained strong in upward momentum, there are several other factors related to overall market conditions and economic situations that would warrant some caution in evaluating PCLN’s near record high stock price. First of all, Dow Jones, S&P 500, and NASDAQ, have all advanced more than 10% on the monthly basis, i.e. 11.25%, 12.77%, and 16.80%, respectively, as compared to the levels at the end of December 31, 2012. The stock price of PCLN has been lifted up also by over-enthusiasm in the market and precautious sellings of shares in order to reap in gains before Fed changes its course in the monetary policy. A CNBC report mentioned that Fed’s taper action will come more likely in September rather than in December, since some economic data, i.e. monthly retail sales, came in almost as expected by consensus. According to this CNBC report, more market participants have decided to sell off some of their stock holdings in case that Fed starts to activate some measures in tapering off its bond-buying program during its FOMC meeting on September 17-18.
Case in point: Orbitz Worldwide, Inc.’s (OWW) second largest shareholders, PAR Capital Management, has sold about a third of its investment in the online-travel company, according to this WSJ article.
Another cash in point: Previously, we have also mentioned in one of our previous posts: YHOO: Cash Out Now or There is More to Come?. Third Point, LLC had also unloaded two-thirds of its Yahoo holdings, 40 million shares at $1.16 billion, back to Yahoo.
Moreover, some market participants, i.e. Marc Faber, publisher of the Gloom, Boom & Doom Report, had repeatedly talked about a market crash, i.e. 1987’s, will come soon possibly in the second half of 2013, according to this CNBC report. The following is his comment:
“In 1987, we had a very powerful rally, but also earnings were no longer rising substantially, and the market became very overbought,” Faber said on Thursday’s “Futures Now.” “The final rally into Aug. 25 occurred with a diminishing number of stocks hitting 52-week highs. In other words, the new-high list was contracting, and we have several breaks in different stocks.”

Bottom Line: PCLN’s new record high price has been birthed in a very different timing and environment than its predecessor during internet-bubble era. Moreover, several different factors related to macroeconomic conditions may warrant investors to think twice when evaluating PCLN.
Z: In Defensive Position Amid Growth Momentum
Zillow, Inc. (Z) released its second-quarter financial result yesterday, which came in at net loss $10.23 million, equivalent to a loss of 30 cents per share, according to this article on investors.com. Excluding share-based compensation, Zillow, Inc. had profit of a penny per share in the second-quarter. In other words, share-based compensation has eaten into Zillow’s profitability, which can be both good and bad signs.
Before we go into discussion of how Zillow, Inc. expanded its cost structure, let’s first take a look at its financial statements excerpted from Form 10-Q filed on August 6th, 2013. We can see that on its balance sheet, Zillow has not had major activities for the three months ended June 30, 2013. Its cash, cash equivalent, and short-term position has 53% of total assets, as of June 30, 2013, as compared to 63% of total assets, as of December 31, 2013. The 10% difference in its cash and short-term investment position is accounted for in the increase of its long-term investment, from 3.09% of total assets, as of December 31, 2012, to 12.08% of total assets, as of June 30, 2013. No M&A activity for Zillow, Inc. has been recorded for the three months ended June 30, 2013. As for liabilities side, Zillow, Inc. has maintained its current liabilities and deferred rent altogether under 10% of total assets, which also shows that company didn’t choose to execute bit-ticket item investment or acquisitions for the three months ended June 30, 2013. So the focus now is on its P&L. Revenue has shown a strong growth rate on quarter-to-quarter basis, that is, 69% growth rate for the three months ended June 30, 2013, as compared to a year ago. Similarly, when we look at year-to-date basis, it is also inline with 69% growth rate for six months ended June 30, 2013, as compared to same period a year ago. Revenue is largely driven by the growth rate in numbers of Premier Agent Subscribers added for the past quarter. The number of Premier Agent subscribers has increased to 38,807, as of June 30, 2013, as compared to 22,696, as of June 30, 2012. The year-to-year change is 71%. As we discussed in our previous post, Real Estate Information Companies: Zillow & Trulia – Part I, we had pointed out that, on average, every premier agent subscriber has brought in $2,934 revenue dollars in 2012, which was $1,467 for a six-month period in 2012, regardless of any seasonal effects. The marketplace revenue for the six months ended June 30, 2013 is $67.47 million, which is 78.56% of total revenue for the same period. Then we can see that every premier agent subscriber has brought in $1,739 revenue dollar for the six months ended June 30, 2013, which is a 18.51% increase as compared to $1,467 revenue dollars for a six-month period in 2012. Even though this is a rough estimate in capturing how much a premier agent subscriber has contributed, yet marketplace revenue per agent is one of the key factors in driving Zillow, Inc.’s revenue. Instead of just looking at the revenue growth on the year-to-year basis, we can have a sense of how revenue per paying agent has fared.


On its cost structure, Zillow, Inc. has 116.37% growth rate in its total cost for the three months ended June 30, 2013, as compared to a year ago. Most of this increase concentrates in share based compensation, which was scattered in three different accounts, namely, sales and marketing, technology and development, and general and administrative accounts. For example, a $7.1 million of share-based compensation expense within sales and marketing was triggered due to a result of the accelerated vesting of the restricted stock units between Zillow, Inc. and its former employee. This should be a one-time surge in share-based compensation expenses. Simultaneously, we also see that Zillow, Inc. has adopted a more aggressive policy in deciding its depreciation and amortization. The depreciation/amortization expenses in six months ended June 30, 2013 is $9.93 million, which exhibits a 95.36% increase from a year ago. This amount also contributed to the red ink of its bottom line in second quarter 2013.

Meanwhile, since Zillow, Inc. has increased its authorized shares available for grants in its stock option program since 2013 and the exercise price per share subject to existing options is at relatively low price range, i.e. $9.65 ~ $22.27, compared to Zillow, Inc.’s current market price, $83.73, as the closing price on August 7th, 2013. We expect to see Zillow, Inc. to have more proceeds from exercise of class A common stock options for the next quarter. This will provide more cash cushion for Zillow, Inc. in the next quarter. Zillow, Inc. has engaged more long-term investments in the second quarter, $36.47 million in U.S government agency securities, as of June 30, 2013, as compared to $7.08 million in U.S government agency securities, as of December 30, 2013. As the uncertainties loom regarding when Fed will taper its current monetary program, it is good to see that Zillow, Inc. has joined with other companies, to put their cash into work by earning more interests, which is not tapped into a year ago.
Bottom Line: Zillow continue to exhibit a strong growth in revenue yet it has slowed down on M&A and investment front. Its recent record stock price will be put to test along with the resiliency of its growth momentum.
LNKD: A New Stage On The Road to More Growth
LinkedIn Corporation’s (LNKD) stock price, on July 18th 2013, reached a record high at $207.23 since it IPO in 2011, according to the data compiled by Yahoo Finance. Currently, as of July 24th, 2013, it stands at the around $195, with only 6% slip from its record high. However, just not long ago, Linkedin Corporation issued its guidance for second quarter revenue $342 to $347 million, which is lower than the consensus estimate by analysts, $358 million. This news, on May 2nd, 2013, had triggered on its stock price a 20% drop on a single day. So the volatility of LNKD, even though not always visible, would have certain impact to its stock price, especially when facing surprises perceived negatively by market.
With this said, let’s take a look at LNKD’s most recent quarter performance and we would have a better picture of how it will come out at the release of its second quarter earning few weeks from now. First, LNKD has maintained a steady cost structure and it seems that every expense item has been associated with certain percentage of total revenue. For example, sales and marketing for the three months ended March 31, 2013 has stayed at 33.70% of total revenue, as compared to the same account a year ago at 34.96%. Similarly, Product development and depreciation/amortization have both stayed at the same percentage of total revenue as a year ago. So in maintaining this steady structure, investors might put more pressure on the growth rate of revenue, in LNKD’s case, that would be the growth rate of LinkedIn Corporate Solutions Customers, advertisers using Linkedin Marketing Solutions and members using Linkedin Premium Subscriptions, etc.


On its balance sheet, almost every item has stayed the same percentage of total assets for three months ended March 31, 2013, as compared to December 31, 2012. Cash, cash equivalent and short-term investment has stayed altogether 54% – 55% of total assets for the three months ended March 31, 2013, as compared to December 31, 2012. PP&E would be one of the few accounts that have some meaningful increase in book value, which is about 1.2% increase of total assets. As for goodwill account, LNKD had spent $130 million in acquiring several companies in 2012, including Slideshare with a purchase price of $74.1 million immediately recorded on LNKD’s book and subsequently the post-acquisition compensation expense and retention bonus will accrue up to $45 million for the next two years since the date of acquisition, according to LNKD’s latest Form 10-K. The strategy of picking up competitors through M&A is not going to slow down any time soon for LNKD, considering it has recently acquired Pulse on April 11, 2013, according to this official news release from Linkedin Corporation. However, in both Slideshare and Pulse transactions, Linkedin has managed to keep the portion of cash payment low relatively to the stock portion involved in the final buying prices. For example, LNKD has only paid out 27% of the total consideration in cash to acquire Slideshare on the date of acquisition, meanwhile, in the similar fashion, Linkined Corporation has only paid out 10% of the total consideration in cash to acquire Pulse. These payoff structures reflect two facets of how Linkedin approached these acquisitions. One is to keep liquidity on hand while seeking for more opportunities to snap up smaller competitors. The other is to ride the current high wave in its stock price, as its stock price stands at nearly the record high, there is a lot of leverage room that can be utilized when considering a deal for M&A activity. We expect to see that Linkedin Corporation continues to keep abreast of companies with fast growing user bases in internet, mobile, and content marketing sectors.
In terms of cash management, LNKD has $303 million in U.S. Agency securities and $$155 million in Corporate debt securities, as of December 31, 2012. It has increased both its U.S. Agency securities holdings to $336 million and Corporate debt securities holding to $195 million, as of March 31, 2013. These holdings imply that Linkedin Corporation has incorporated a scenario that economic headwinds might be caused by the Fed’s possible tapering action before the end of year. It is interesting to see that more than 40% of combined cash, cash equivalent and short-term investment is tied to U.S. agency securities, which might generate interest income depending on the type of U.S. agency securities Linkedin has on hand, which is not disclosed in its Form 10-Q currrently.
Bottom Line: Linkedin Corporation has swiftly gone through a transformation since its inception as a public company, however, whether it can propel its growth in paying member base in the immediate future is a question for investors to ponder about.
YELP: LET THE M&A BEGIN
Yelp Inc. (YELP) had announced today that it acquired SeatMe, Inc, a web and iPad-app based reservation solution for the restaurant and nightlife categories, according to this article on PR NewsWire. The same article discloses the details on this transaction, under the terms of the acquisition agreement, Yelp will acquire SeatMe for approximately $2.2 million in cash and up to approximately 263,000 shares of its Class A common stock, for a total purchase price of approximately $12.7 million (subject to customary working capital adjustments). With its stock price hovering around the record high, Yelp has chosen to buy off SeatMe largely with its stocks, not cash. It is a nice move considering that Yelp’s stock price has just recently risen to a new level from around $25, as of May 1st, 2013, after its guidance for second quarter of 2013 above analysts’ estimates. Another nice thing about this transaction is that the business model of SeatMe, Inc. is to charge monthly fees for use of their iPad-based restaurant reservation and guest management system, according to the description on Wikipedia, and complements the existing business model of Yelp.
Last year, Yelp has acquired its cross-Atlantic rival Qype, which was completed on October 23, 2012, for approximately $24.3 million in cash and Yelp Class A common stock with an approximate fair value of $23.3 million, according to Yelp’s latest Form 10-Q.
These transactions represent not only strategic moves to benefit Yelp’s existing business, in our opinion, they also signify that Yelp might be in buying mood to fetch up more companies for the rest of the year.
How so?
Let’s take a look at Yelp’s financial statements briefly then we will explain further.
As of March 31, 2013, Yelp has released the following balance sheet and income statement.


The first thing that we noticed in Yelp’s balance sheet is that not too many of activities changed for the three months ended March 31, 2013, as compared to a year ago. Its cash and cash equivalent position is around 50% of total assets and goodwill, as its second largest account, occupied around 25% of total assets. So from here, we can see that Yelp might have been contemplating on how to put its cash, i.e. 50% of its total assets, into work and acquire companies to boost up its revenue.
As for the revenue side, almost every account stayed the same percentage in total assets as they were a year ago, except sales/marketing and general/administrative accounts. The reduction in sales and marketing account, i.e. from 68.54%, as of March 31, 2012, to 61.11%, as of March 31, 2013 and in general and administrative account, i.e. 39.18%, as of March 31, 2012, to 19%, as of March 31, 2013, shows that Yelp had started to rein in its cost structure, even in the midst of ongoing mergers and acquisitions, i.e. restructuring plan in reducing headcount from the Qype transaction in 2012. Therefore, we can see that Yelp has focused more on its bottom line, rather than just numbers of unique visitors.
Lastly, Yelp has disclosed that it has, as of March 31, 2013, the following number of unique visitors, claimed business locations, active business accounts and net revenue per active business accounts. Even though the growth rate of unique visitors, claimed local business locations, and active local business accounts are at 43%, 58%, 66%, on the year-to-year basis, the average net revenue per active business accounts stayed the same on the year-to-year basis at around $1014 ~ $ 1025. This might be one of the underlying reasons that Yelp are actively looking for mergers and acquisition targets.

Bottom Line: With Yelp’s stock price climbing to its record high since its IPO in 2012, investors should pay attention on the merger & acquisition targets that Yelp has placed its eye on, since it would determine whether or not these acquired will boost its bottom line.

